Getting started (Prototype Box)
These instructions are intended for participants in the so-called "Citizen Scientist" data collection in the ComCy-project. If you are interested in participating, you can find out more here. You will also find a link to our recruitment questionnaire.
Table of Contents
| Getting Started | Data |
|---|---|
Registration
You find our homepage with all relevant information here: https://bicycledata.vti.se/
You can request a login as follows:
 Click on the person symbol in the upper
right-hand corner on the homepage or follow this link
Click on the person symbol in the upper
right-hand corner on the homepage or follow this link
Sign up with your name and a valid email address. You use the same address to log in to your dashboard and to view, annotate and download your data. We handle registrations manually, so it may take a while before you receive a response.
Unboxing
What you'll get from us:
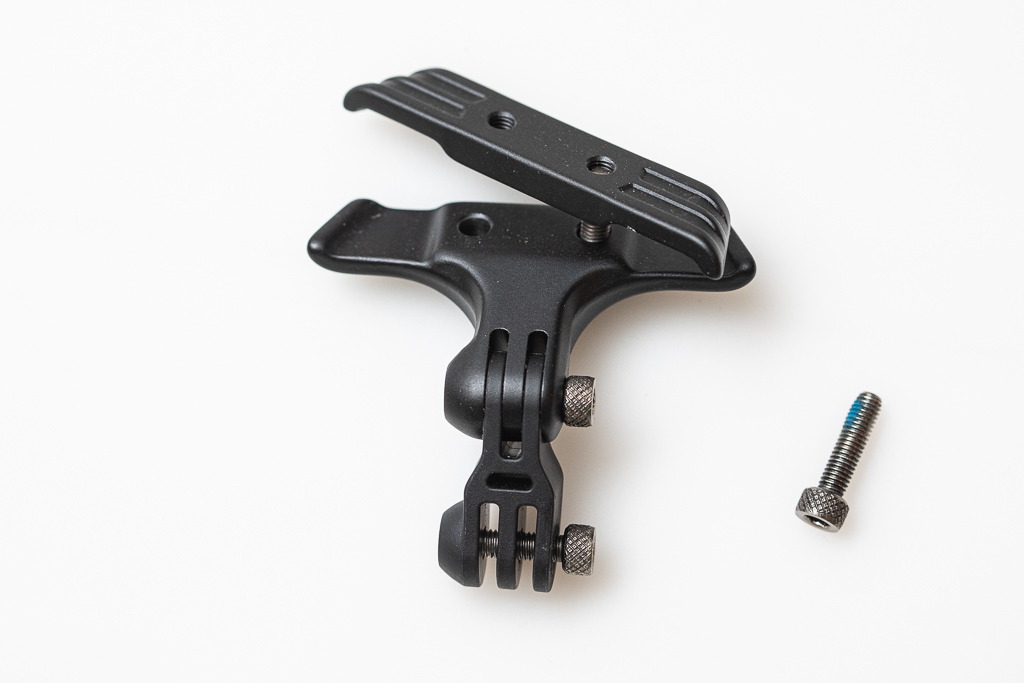
Holder
A holder for Garmin and GoPro devices to attach the logger to your seat rails with an Allen key.
TrafficLogger
A logging device measuring the lateral distance to passing traffic. The device you get can have a different colour and look slightly different, but you will find all the buttons, sensors and LEDs that are described here.
The device contains:
- Raspberry Pi as core unit
- A Lidar-sensor measuring lateral distance to passing vehicles (and everything else on your left side, up to around 10 m)
- GPS-sensor logging your position and speed
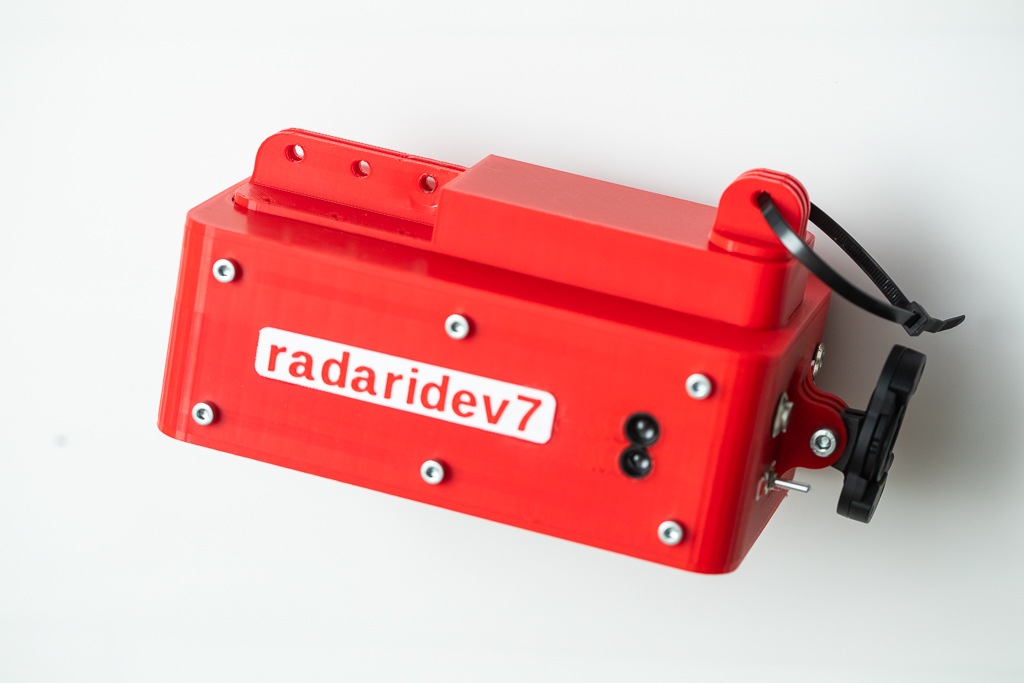 Left side of the device, with the lidar sensor The device is attached to the holder via the holes on top and is secured with a zip tie through the seat rails. |
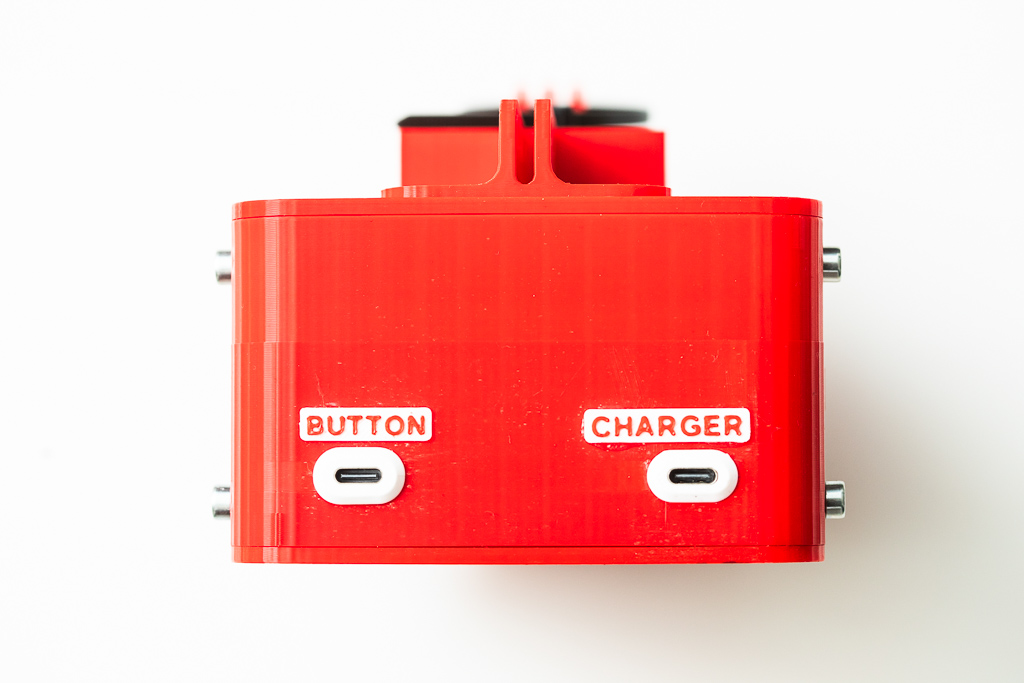 Front side of the device USB-C ports for the button and the charging cable. |
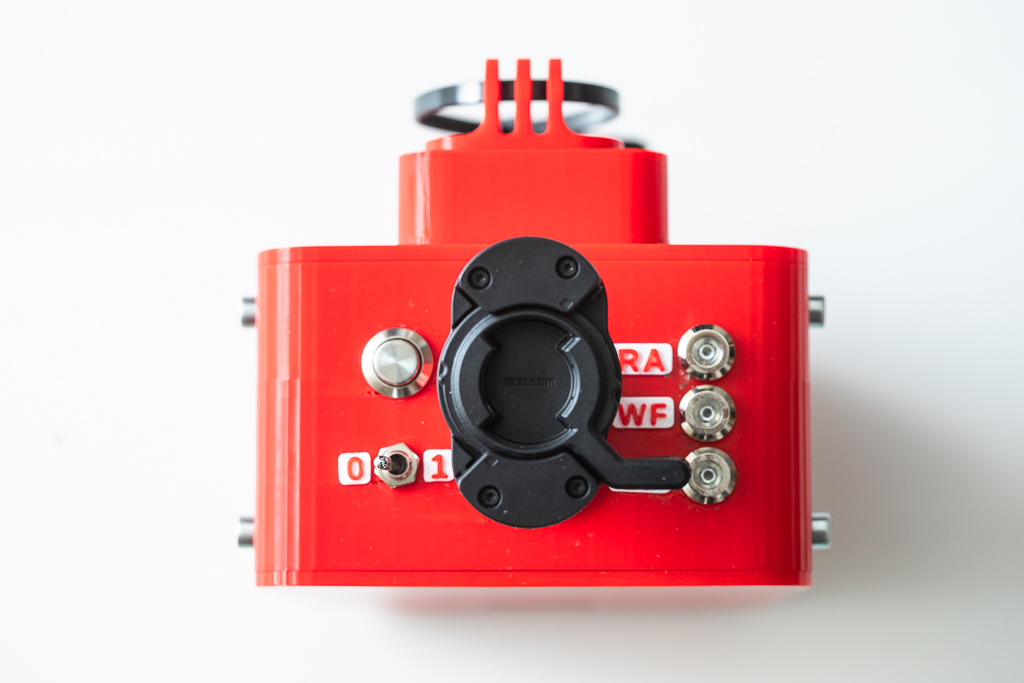 Rear of the device Data button, ON/OFF/Charge switch, and radar attachment point (open). |
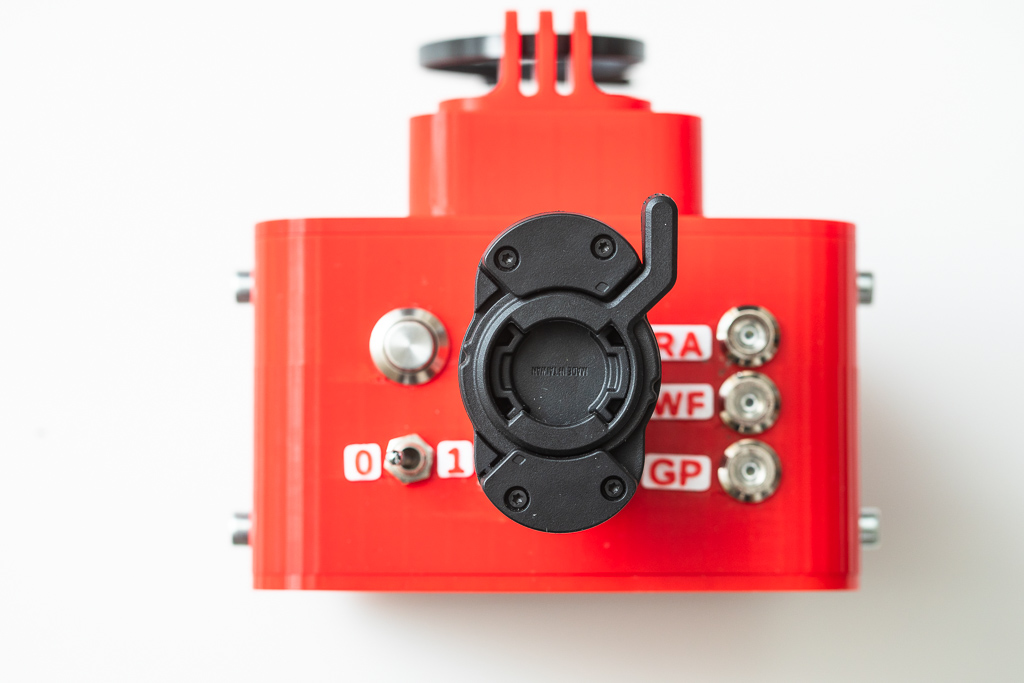 Status LEDs LEDs indicate GPS fix (GP) and connection to Wi-Fi (WF) and radar (RA). The radar attachment point is closed. |
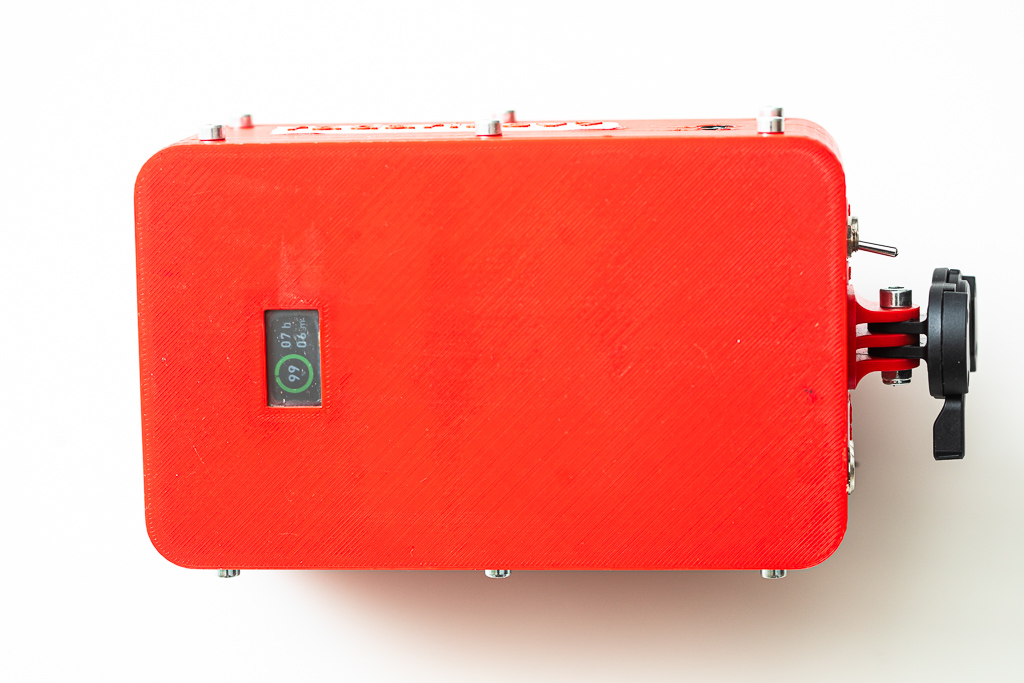 Bottom of the device Window showing battery status after power or charging events. |
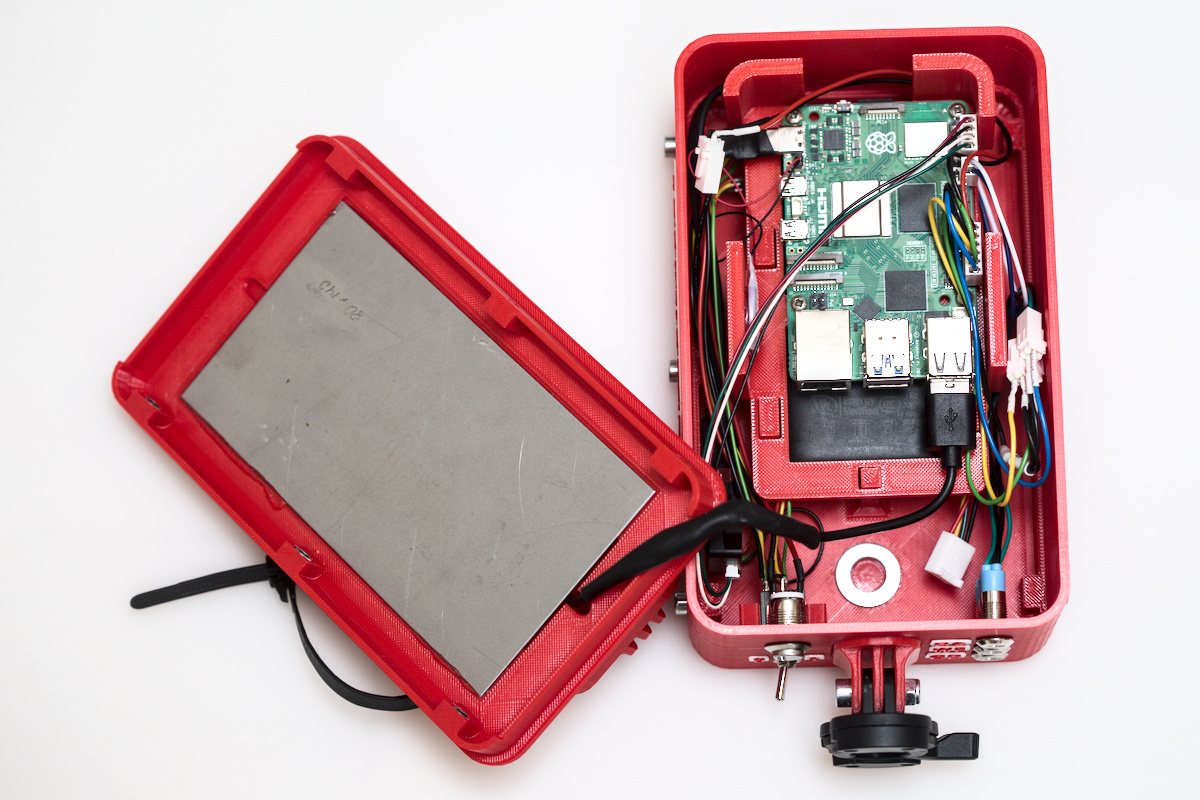 Inside of the device Raspberry Pi, battery, lidar sensor, and other components. |
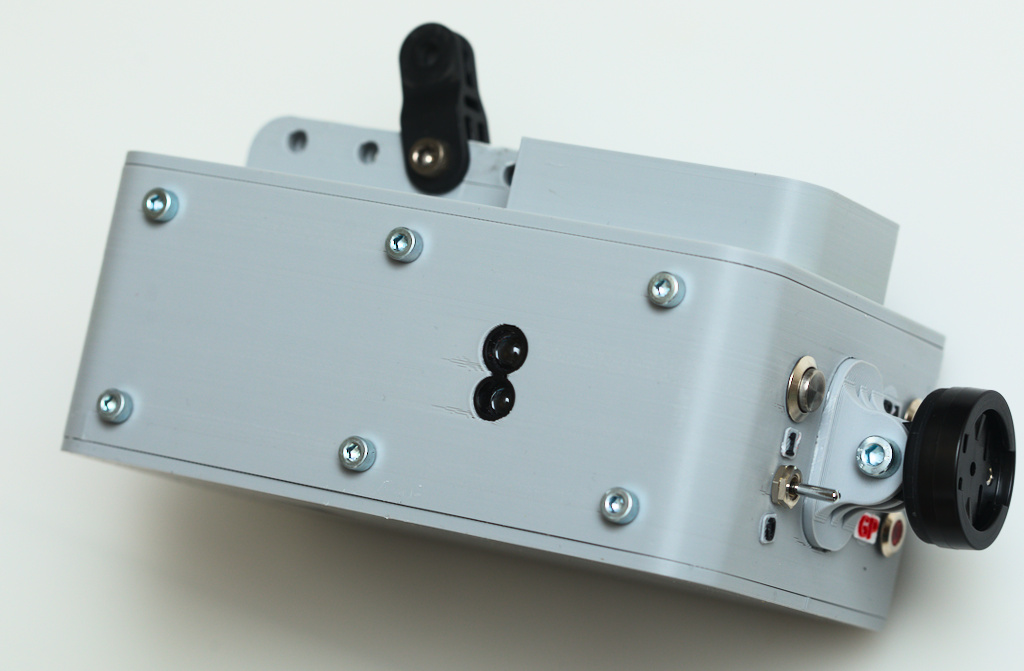 Slightly differently shaped version of the device This version has a slightly different layout of the buttons and contacts, but the functionality is the same. |
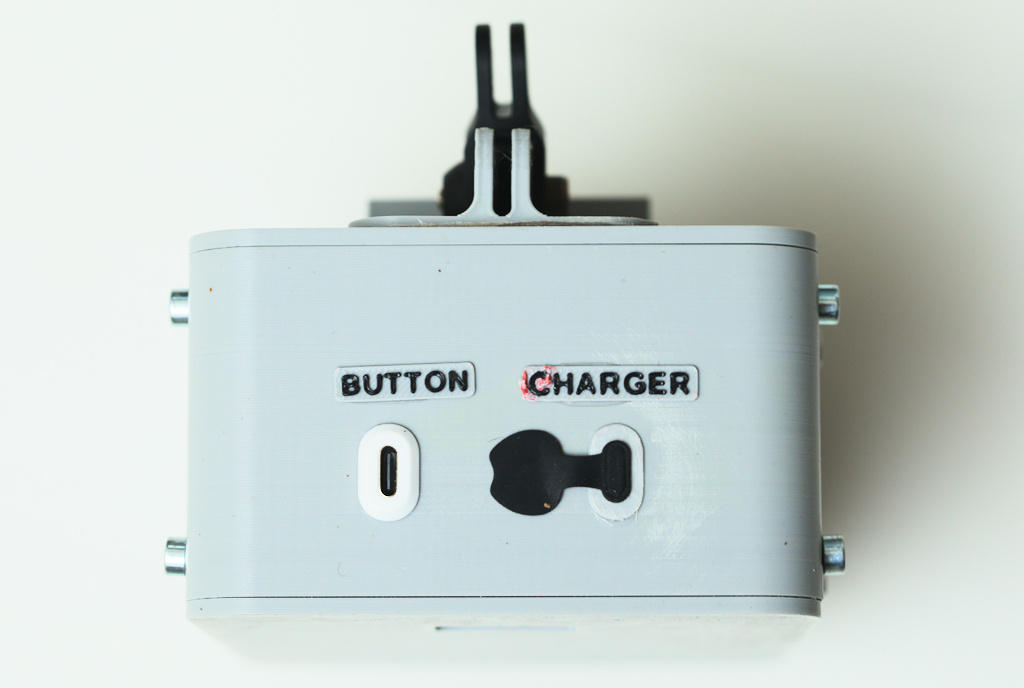 Button and charging port The button and charging ports are vertically aligned, and the charging port has a dust and rain cover. |
Garmin Varia radar
You can use any Garmin Varia in the 3-, 5- or 7-series. The device you will get from us is a Varia 315. The radar is placed on the rear of the logger. It connects to the TrafficLogger via Bluetooth and it registers vehicles approaching from behind, logging their distance and relative speed from a range of about 140 m.
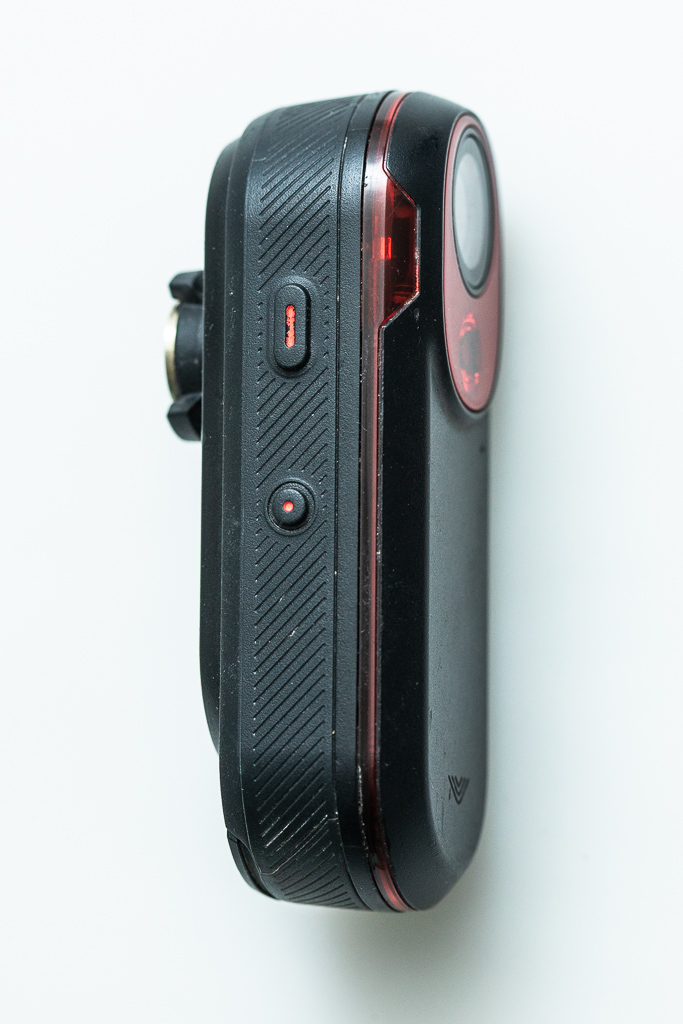 Garmin Varia 716 radar Press the big button on the side for 2 s to turn the device on or off. Charge with a USB-C cable (included). |
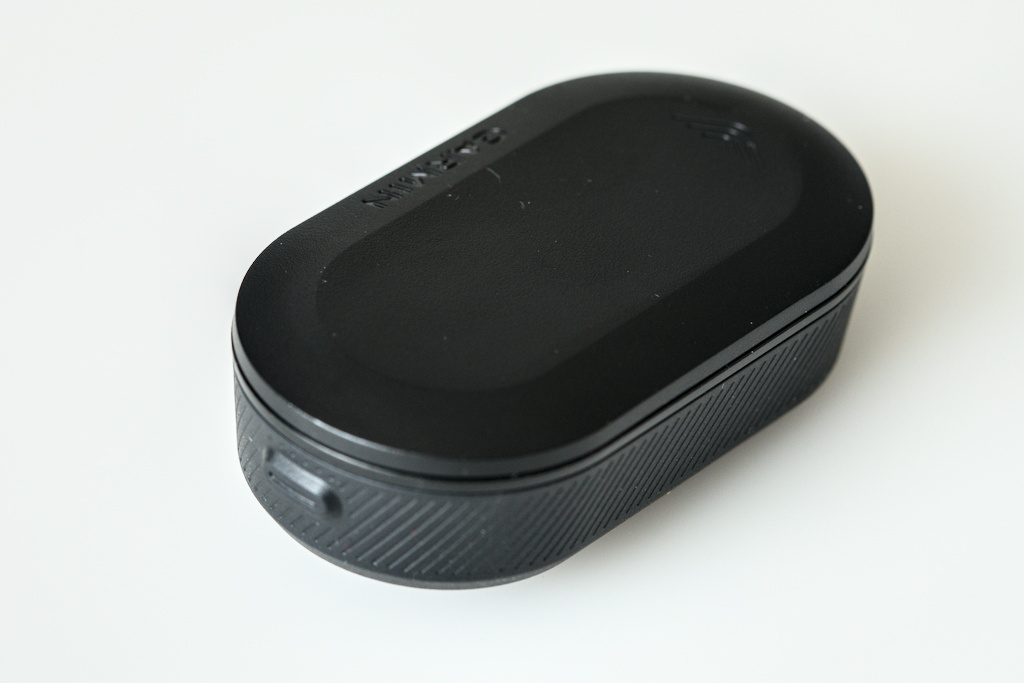 Garmin Varia 315 radar Press the button on top for 2 s to turn the device on or off. Charge with a micro-USB cable (included). |
Button
The button is placed on the handlebars and attached to the logger via USB-C. You mark overtakes (and possibly also oncoming traffic) by pressing the button, for instructions see here.
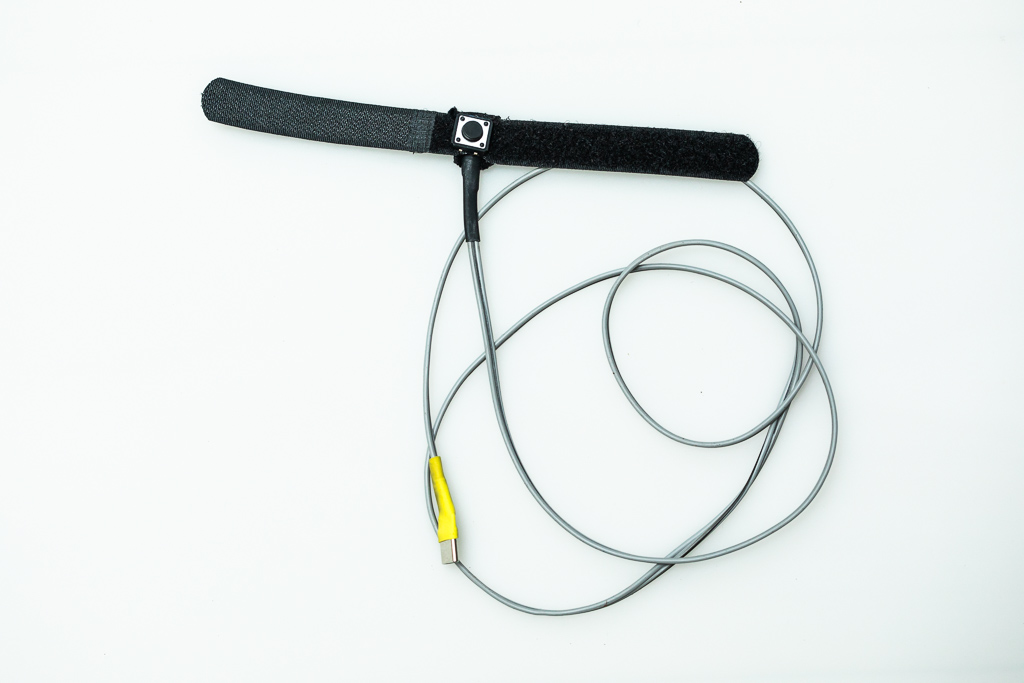 The button to mark passing events You attach the button to the handlebars with the velcro-strip and connect it to the logger via USB-C. |
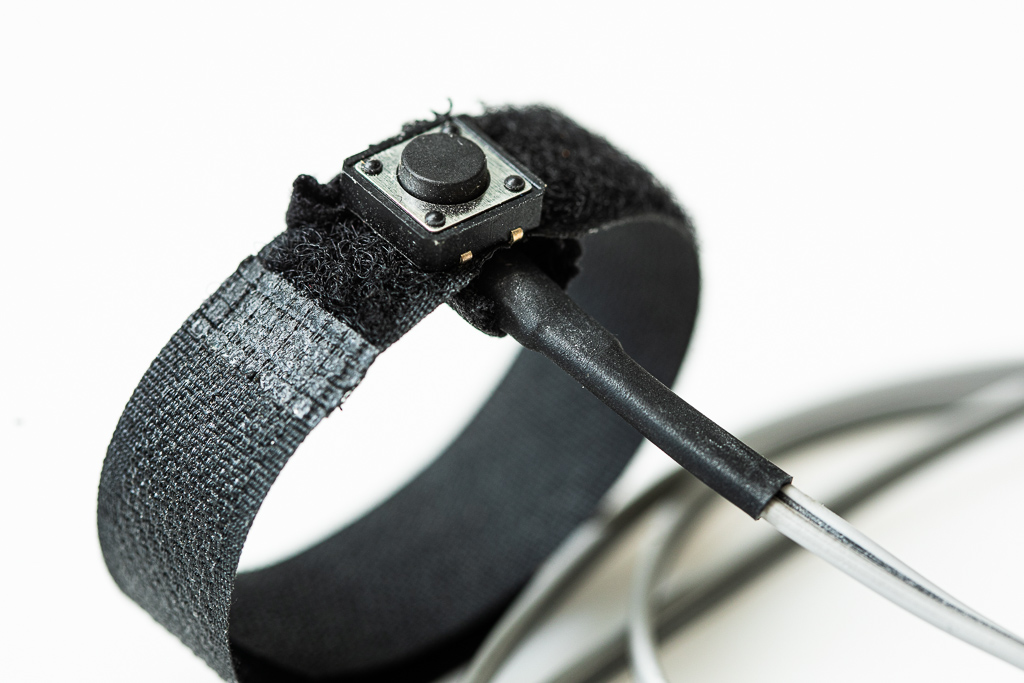 Close-up of button Close-up of the push button you use to mark overtakes. |
Accessories
- USB-C-cable for charging
- USB-C- or micro-USB-cable to charge the Garmin Varia (depends on the model you get)
- A few re-usable zip ties to secure the logger to the seat rails
- A few pieces of soft material to put between the holder clamp and the seat rails
How do I mount the logger?
- Mount the clamp to the saddle rails using an Allen key. It is advisable to place the soft material underneath to avoid scratching the rails. It may take a little creativity to get a good placement, for example some saddles are designed such that it works better to mount the clamp upside down.
- Mount the logger to the clamp (tighten firmly). Test to make sure the logger does not interfere with your pedalling. If so, move it one hole back.
- Secure the logger with a zip tie or similar so that the rear end does not drop onto the wheel due to possible vibrations or shocks.
- Attach the push button to the handlebar using the Velcro. Choose a location that is easy to reach, but where you will not accidentally press the button. You may want to try a few different locations.
- Route the cable from the button along the frame to the logger. Make sure the cable does not get in your way and that you can turn the handlebars freely. You can secure the cable with tape or a zip tie.
- Connect the cable to the logger using the USB connector.
- Attach the Garmin Varia radar to the holder on the back of the logger.
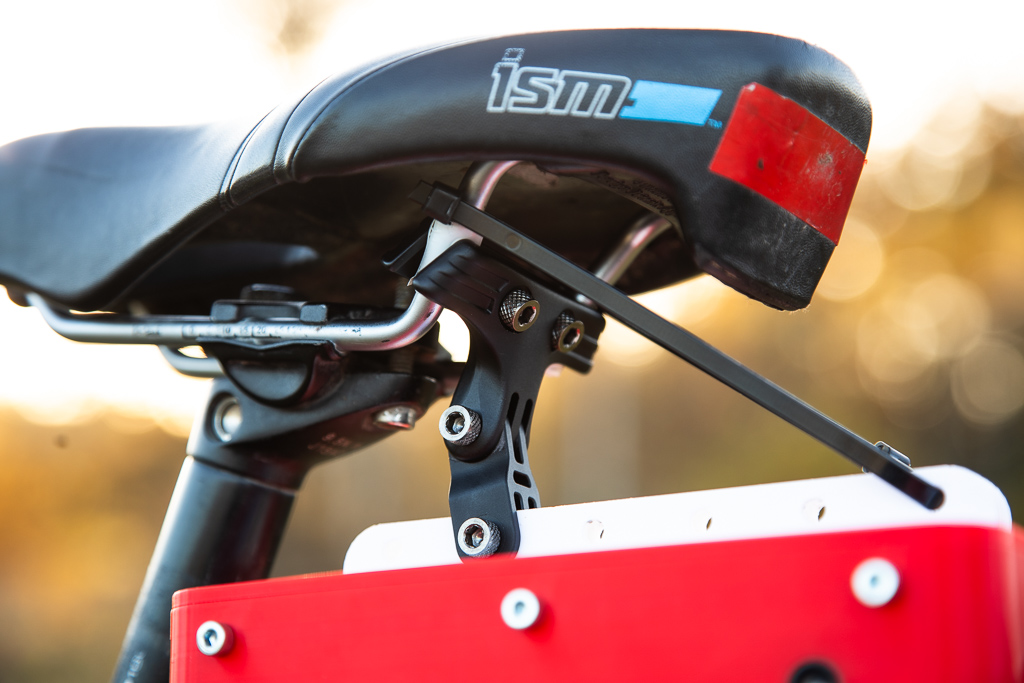 Mount on seat rails Mount the logger on the seat rails choosing a hole as far back as possible and secure with a zip tie through the seat rails. |
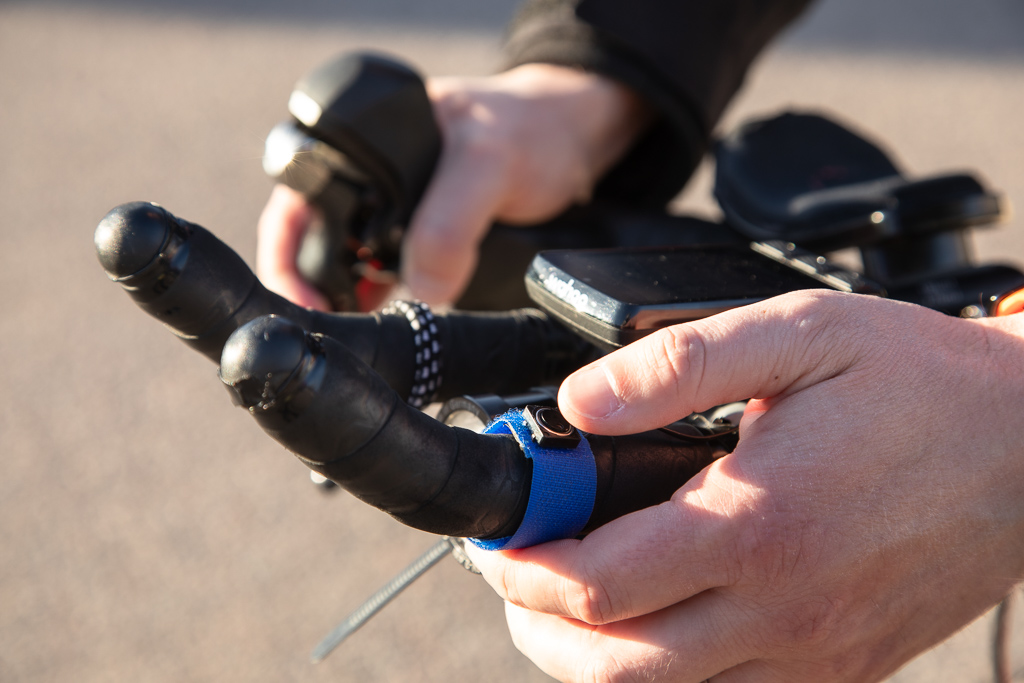 Attach push button Make sure to have the button within easy reach, but "out of the way" for accidental presses. You might want to try several locations. |
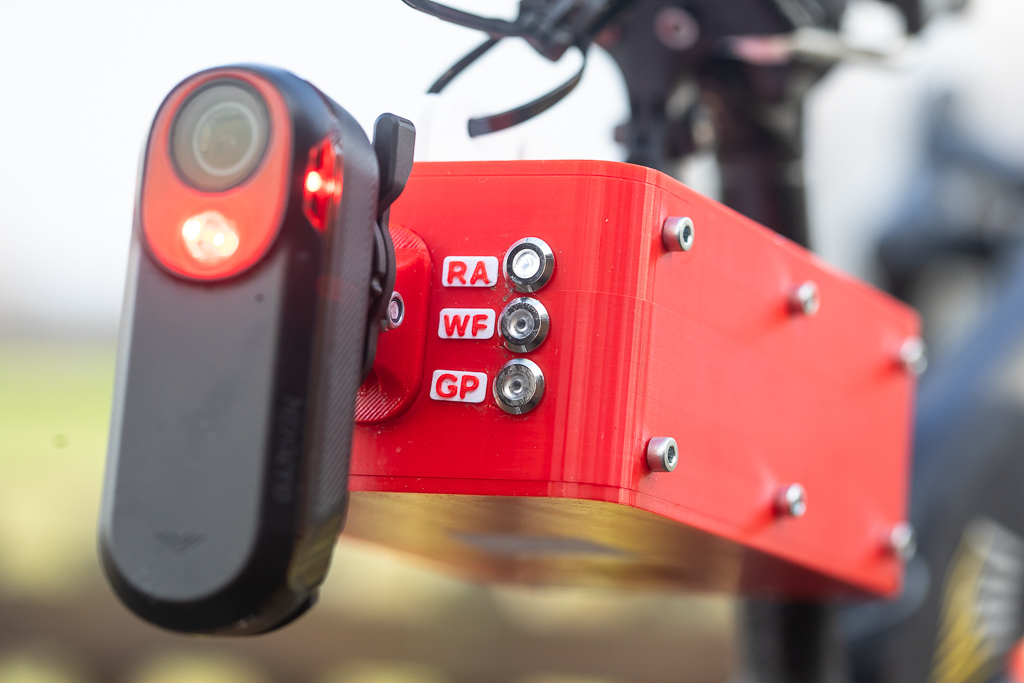 LEDs for status indication Status indicators for radar (RA) - connected, WiFi (WF) - not connected, and GPS fix (GP) - no fix yet. |
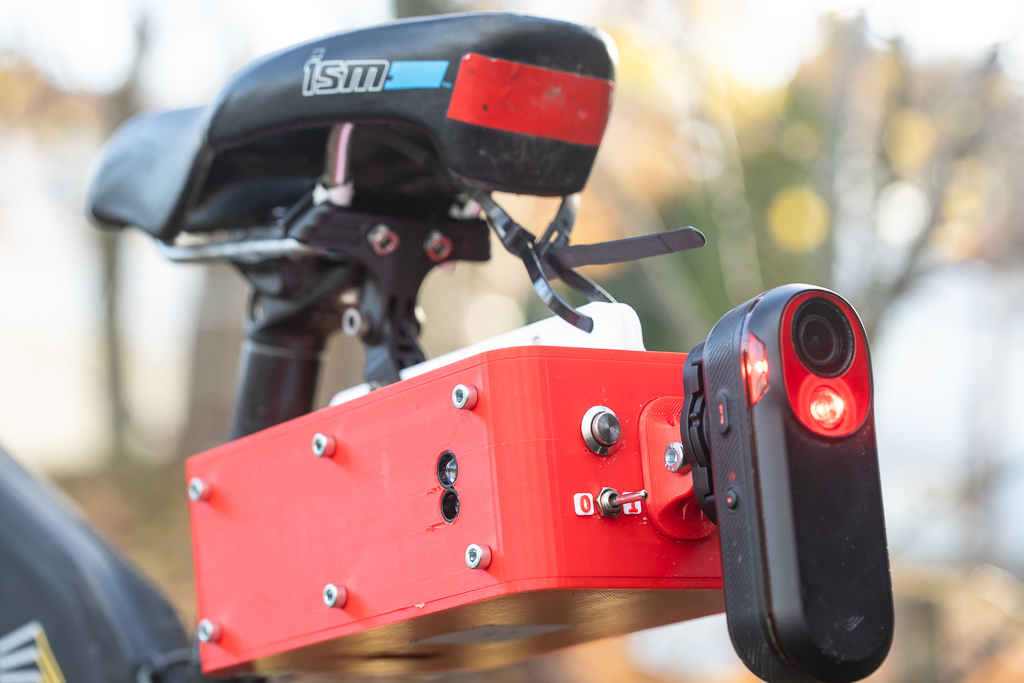 Upload button and ON/OFF/Charge-switch The lidar sensor on the left side, the data button for upload and the ON/OFF/Charge-switch. |
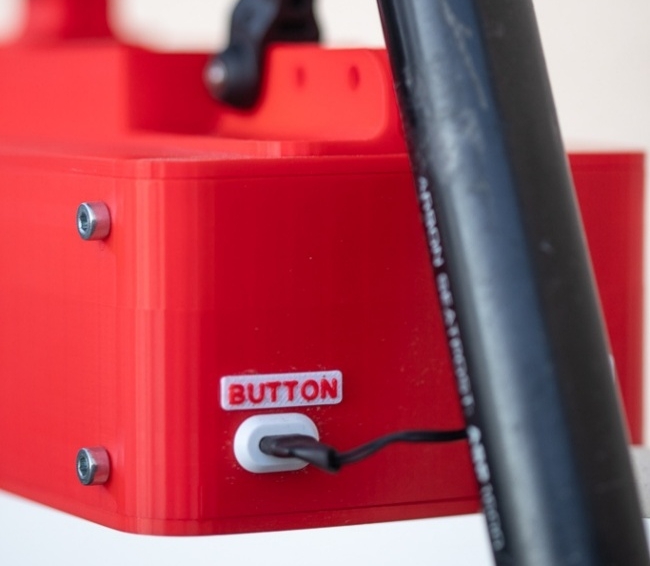 USB-contact for push button Attach the button to the logger via USB-C. |
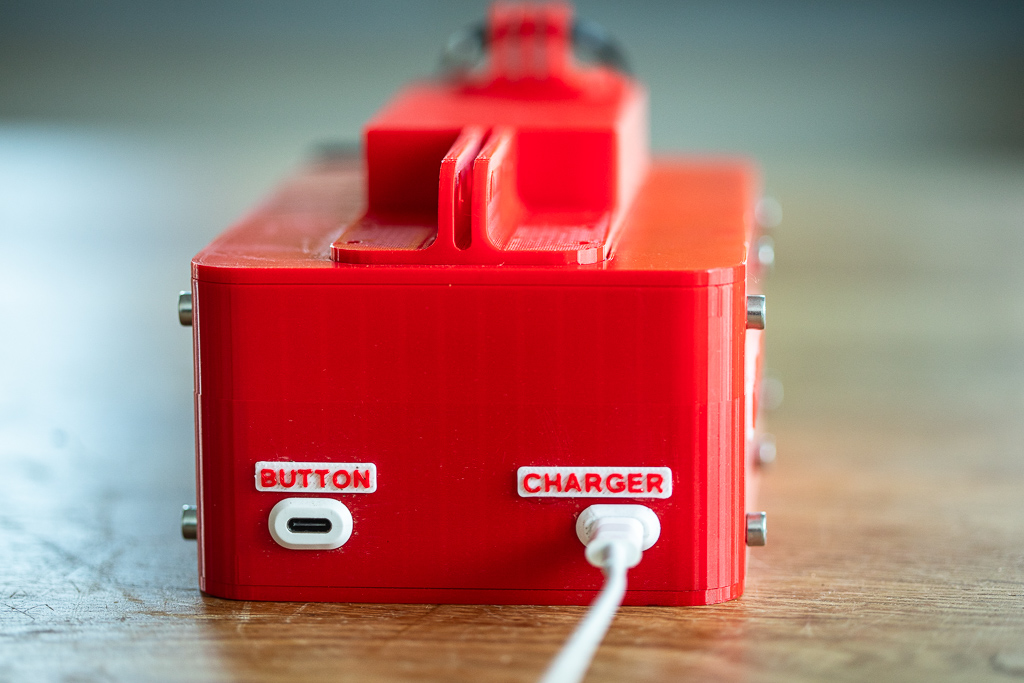 Charge the logger Charge the box with a USB-C cable. Upon attaching and detaching the cable, you can see the charging status for a few seconds in the window on the bottom of the box. The ON/OFF/Charge switch must be set to Charge to enable charging. |
How do I configure my hotspot?
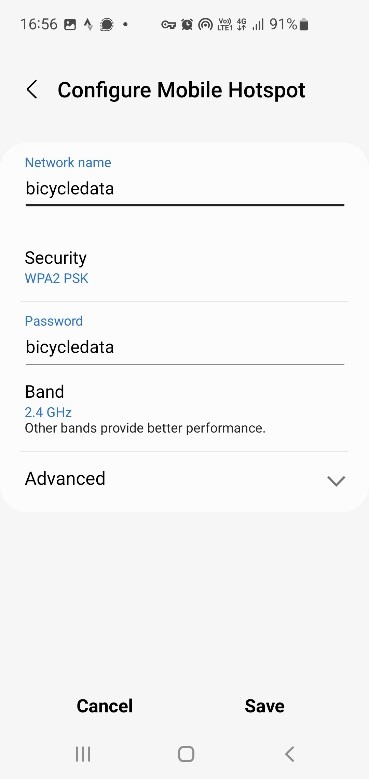
|
On your phone, configure your hotspot such that it is called bicycledataAlso the password should be set to bicycledataUse 2.4 GHz. |
How do I operate the logger?
It is important that you turn the equipment on and off in the described order so that all sensors will be found and the data upload will work. The order is also stated on the sticker on the logger.
Start
- Activate your hotspot (
bicycledata). - Start the Garmin Varia (press the big button on the side for 2 seconds). Varia 315: The LED will flash blue. Varia 716: The LED will turn green, then red. (This can differ between devices.)
-
Start the logger by setting the ON/OFF/Charge switch to ON. It takes one or two minutes to start up.
- WiFi:
WFLED indicates connection to hotspot. - WiFi: When
WFLED turns off, the hotspot can be shut off. - Radar:
RALED indicates connection to Garmin Varia. - GPS:
GPLED indicates a GPS fix (4–7 minutes is not unusual).
- WiFi:
Now you're ready to go riding. Please read here how to mark overtaking events with the button.
Data upload and shutting down
- Activate your hotspot again (
bicycledata). - Press the data button for 5 seconds (until the LEDs start flashing).
- All three LEDS are flashing (data is being uploaded).
- Wait until all LEDs have turned off.
- Turn off the Garmin Varia by pressing the button for 2 seconds. All LEDs on the Garmin should be off.
- Turn off the logger with the ON/OFF/Charge-switch. You can see the current charging level on the display for a few seconds. If you do not set the switch to OFF, the battery will drain.
How do I charge the equipment?
It is easiest if you can leave the logger on the bike for charging. If you have to take it off, it can be easiest do detach the button from the logger, leaving the button on the bike, and then unscrew the logger from the holder by the middle screw instead of removing the holder from the seat rails. The Garmin Varia radar is easy to take off, so that's probably the preferred method for charging it.
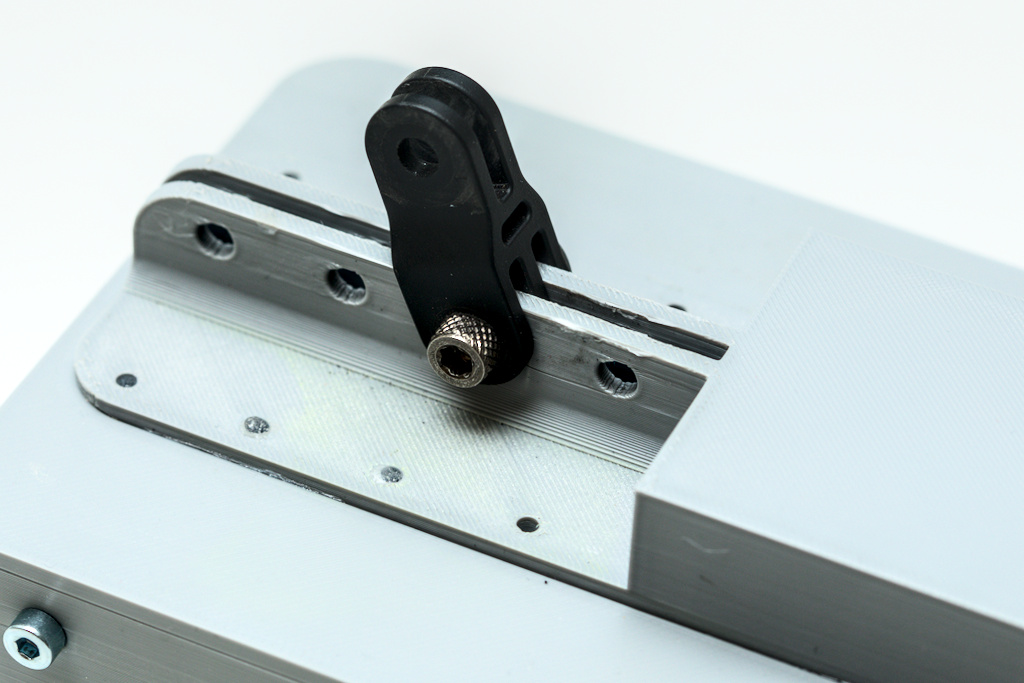 It is easiest to detach the logger like this.
Logger
One charge lasts for around 8-9 hours of riding. Charge the logger via a USB-C-cable. The ON/OFF/Charge-switch must be set to Charge. You see the charging level on the display for a few seconds when you attach or detach the cable.
Garmin Varia
One charge lasts for approximately 6 hours. Charge the Garmin Varia with the enclosed cable. While charging, a LED flashes green. When fully charged, the LED remains on.
My data
After each ride, you upload the logged data as described above. You can then annotate and download your data.
After each ride
Go to the homepage and log in here: https://bicycledata.vti.se/login
Log in on your dashboard after each ride to:
-
Mark whether the data originate from a real ride or if you only tested the
logger and “played” with it (in this case click
hide). -
Mark whether you rode on your own (write
0) or in the company of others (indicate how many people you rode with). - Optional: note the battery status of the logger at the beginning and end of the ride (for future development of the logger).
- Comment on certain events or other things we should know about the ride (traffic situations, weather, overtaking events, logger handling, or anything else you find relevant).
How do I access my data?
Under "Sessions" all occasions when you turned the logger on are listed. You can hide occasions that were not a proper ride. Click on a ride to see its contents.
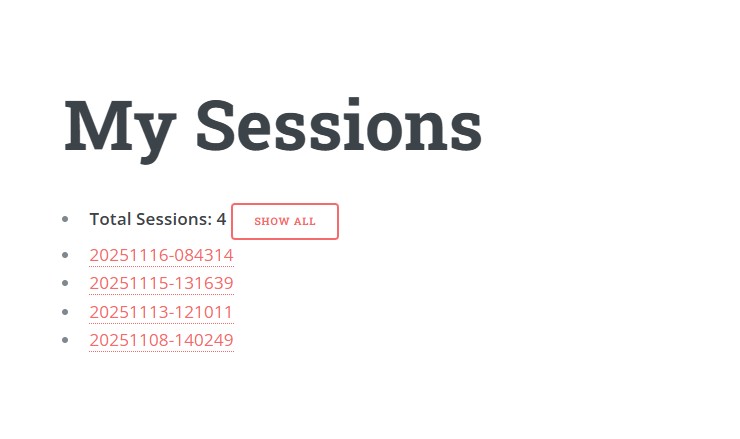
Here you can see some meta-information about your ride and have the possibility to make annotations.
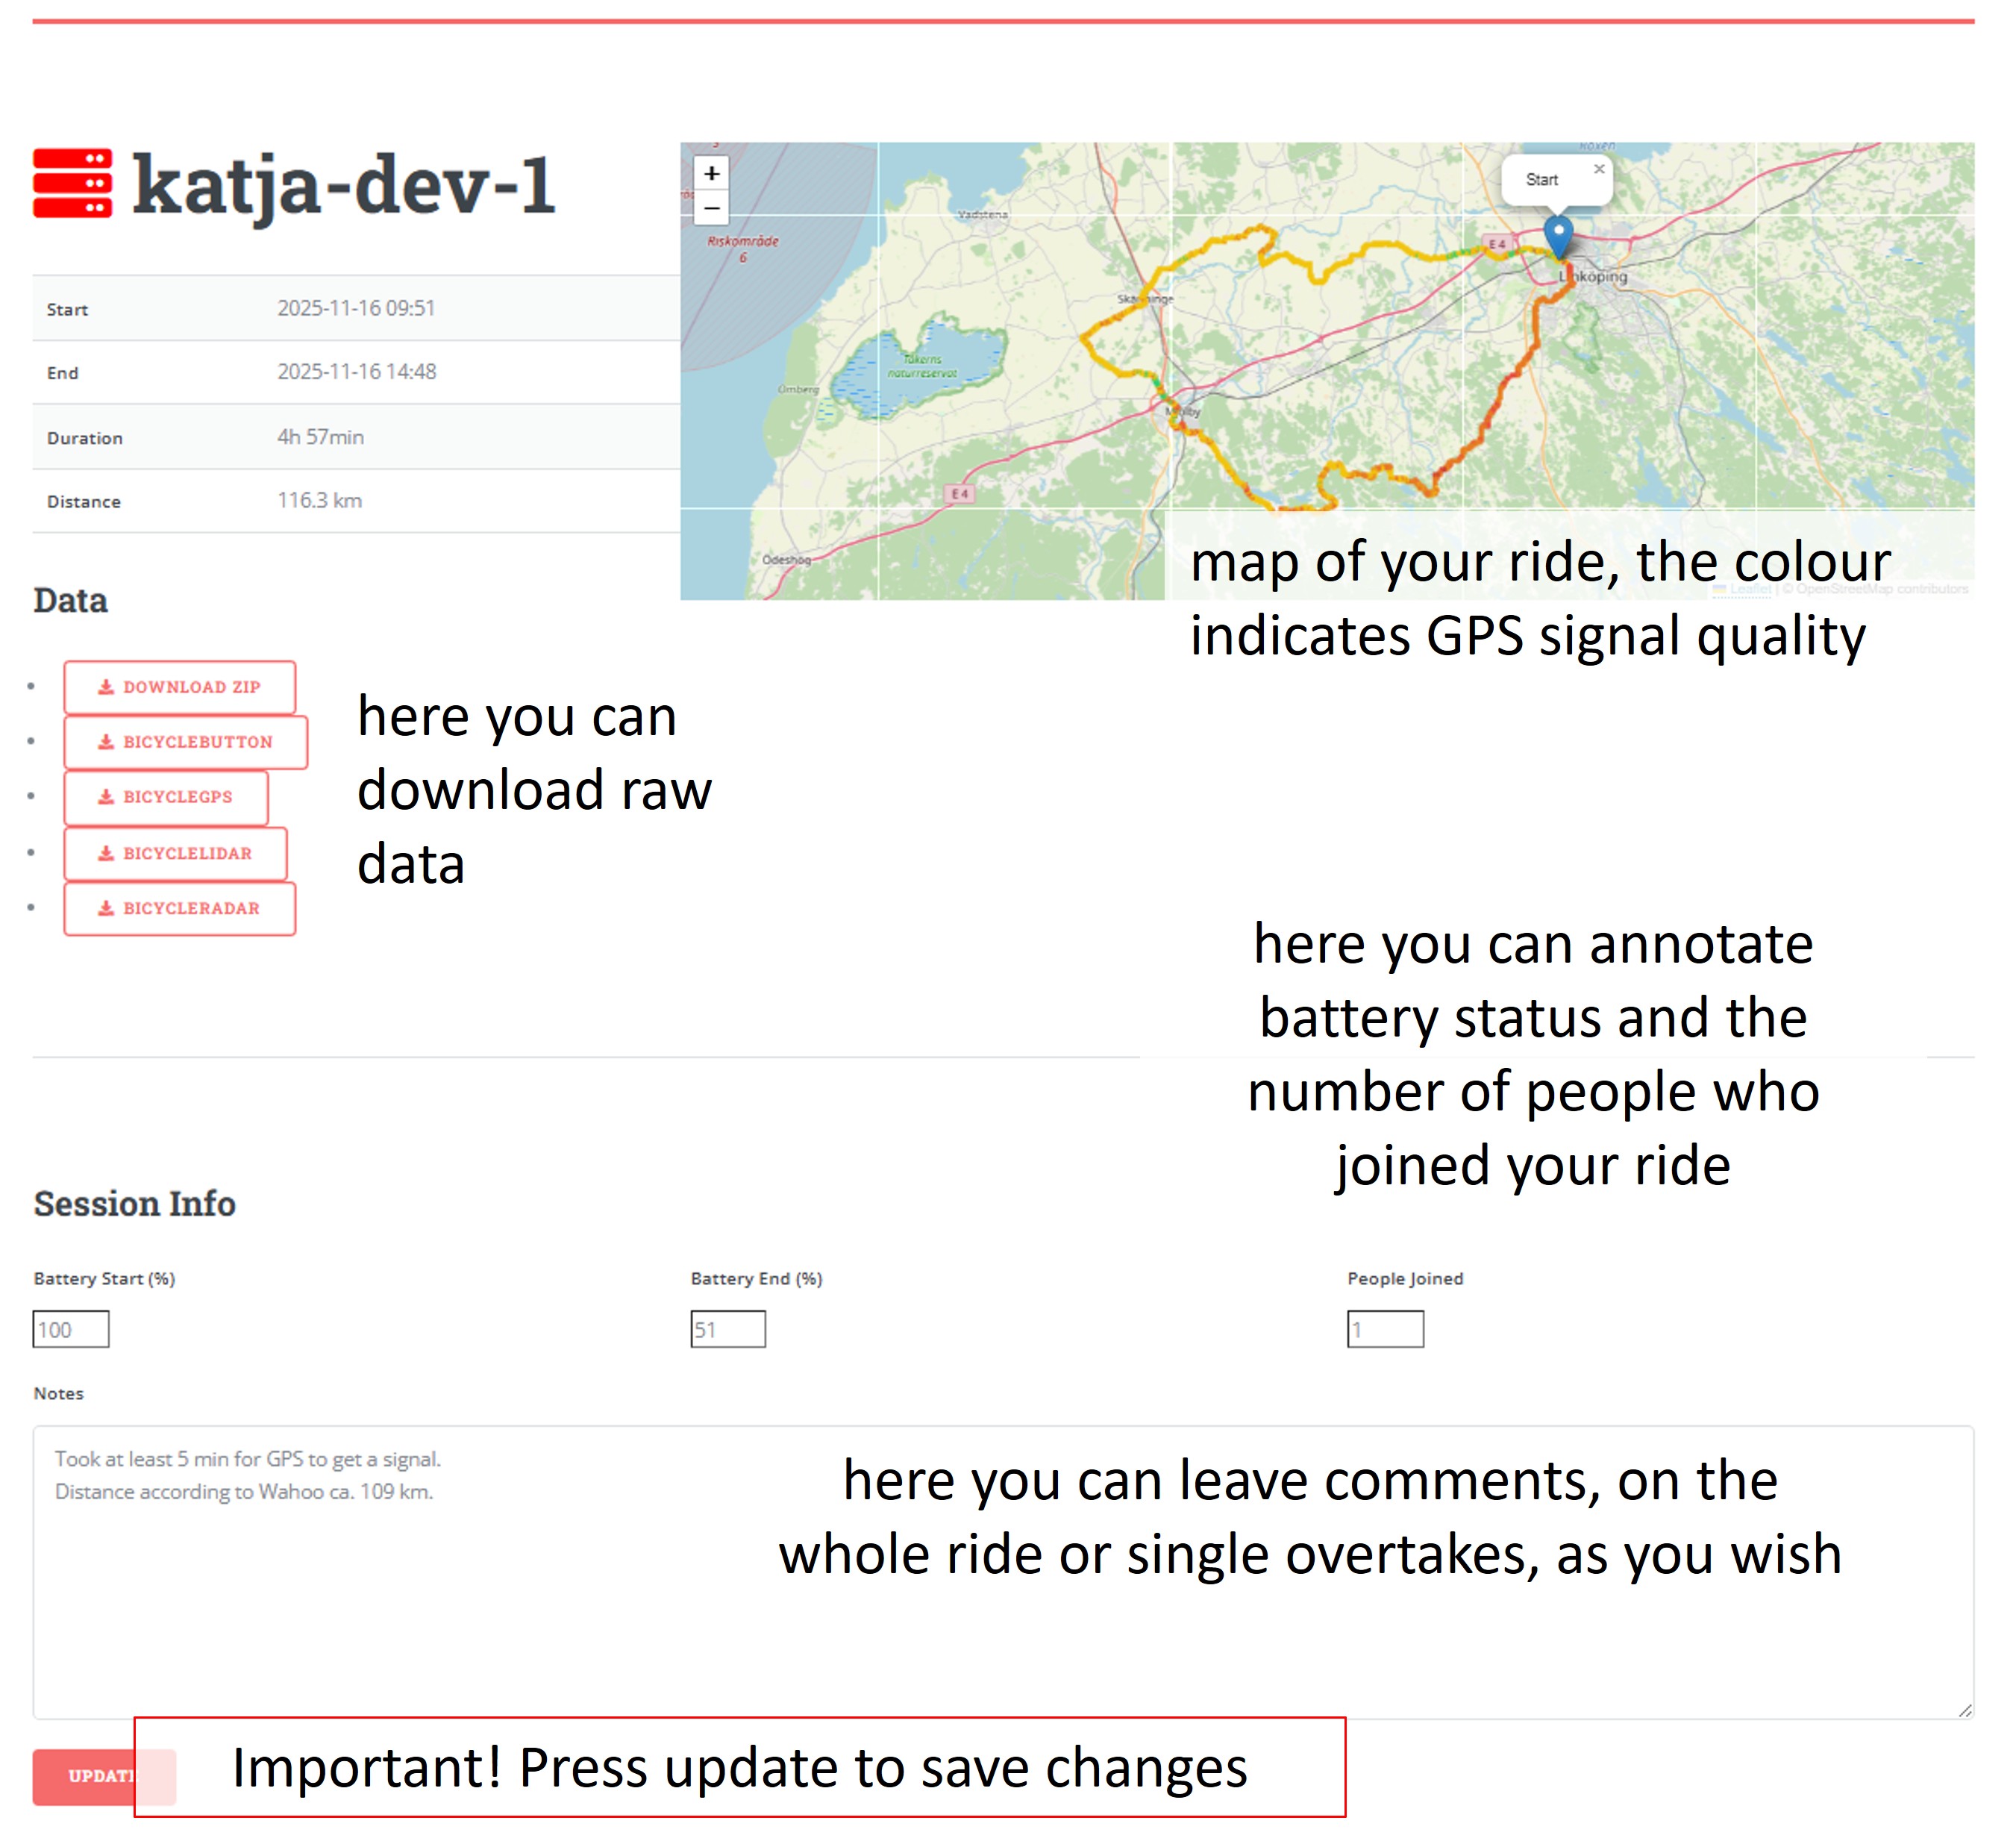
Download data
You can download both the raw data and processed events (observe, currently only raw data are available). Below is a brief description of what this means. For more information, see the detailed description (information to come).
Each sensor generates a file that contains data from your entire ride (raw data). This information forms the basis of our analyses. In addition, there is a data file containing the overtake events found in the material. For each event it contains the location, the lateral distance, the vehicle speed when overtaking and other information. If you also marked oncoming vehicles, you will find an additional file for those passes, but they do not contain vehicle speed.
Who can access my data?
Only you, via your dashboard, and the researchers at VTI who participate in the project can access your raw data. The processed events can be published on openly accessible maps and in other publications, like scientific articles, research reports and on social media. They will be shared with other researchers within the ComCy-project. Processed means that single overtakes and oncoming passes are identifiable via their location and time, but without cyclist ID.
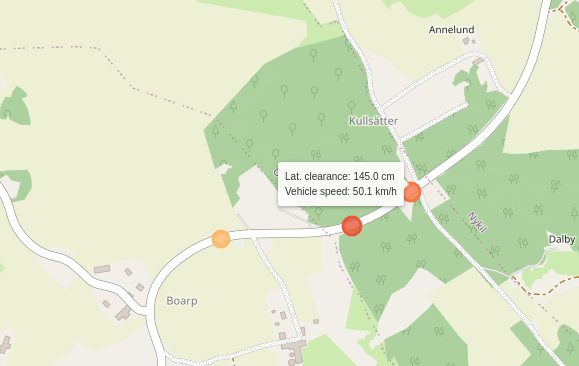
The data could for example be displayed as in the excpert of the map below, where a mouseover shows the speed and lateral clearance of the overtaking vehicle.
What happens when I’m done with the data collection?
Also after returning the logger, you’ll be able to log in, see and download your data as long as the server is running and we have the possibility to maintain it. We cannot give any guarantees about the timeframe, however.